E-Commerce Order Fulfilment & Seller Performance Analysis
Status: Completed — independent PostgreSQL portfolio case study (October 2026) Data: Brazilian E-Commerce Public Dataset by Olist (historical, anonymised records primarily covering 2016–2018) Tools: PostgreSQL 17.11, pgAdmin 4, SQL
I completed this independent portfolio study using historical public data. It was not commissioned by Olist.
Project overview
This case study uses relational SQL to examine marketplace order fulfilment, seller-associated order activity, delivery trends and customer review scores. The emphasis is on correct data grain, defensible KPI denominators, source-to-result reconciliation and query-performance evidence, rather than dashboards or speculative commercial impacts.
Business questions
- How often do eligible delivered orders arrive after their estimated delivery dates, and how does this change by purchase month?
- How can seller-level metrics be calculated without double-counting multi-item or multi-seller orders?
- How are delivery delays associated with review scores, and how might review coverage affect the interpretation?
- Can an alternative SQL aggregation preserve seller KPIs while executing more efficiently?
Key findings
I found a 6.77% late-delivery rate across 96,470 eligible delivered orders, with a mean positive delay of 10.62 calendar days. Among reviewed eligible deliveries, the 1–2-star share was 9.27% for on-time/early orders and 80.15% for orders delayed 8–14 days.
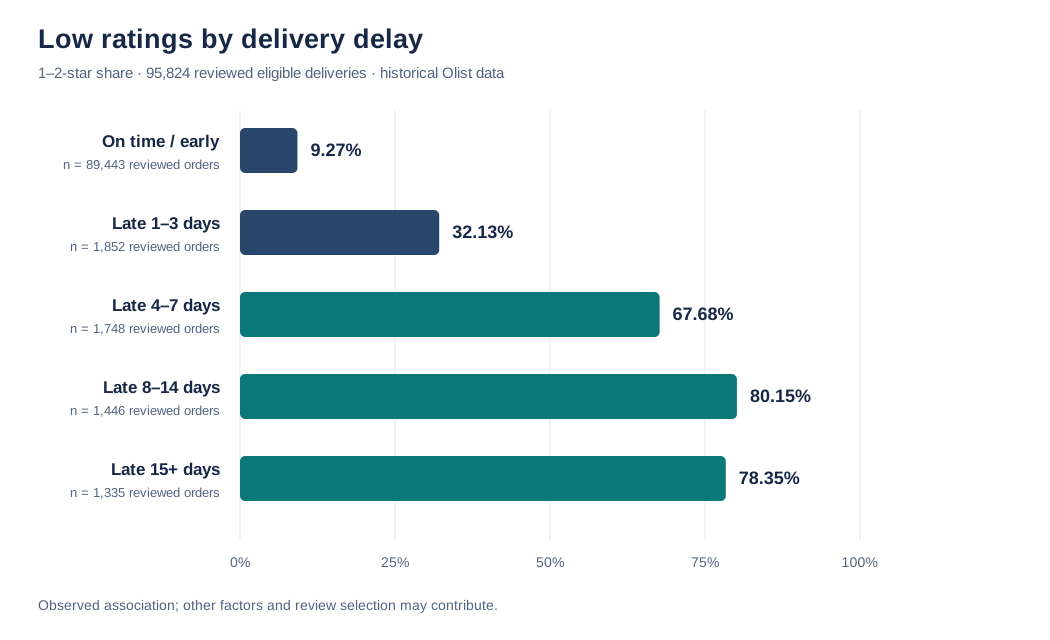
Decision relevance: I would prioritise investigating orders delayed four days or more, then examine carrier, seller, product and review-selection factors before proposing interventions. These are observed associations. Detailed findings and denominators.
Data and analysis design
Exactly four source tables were imported:
| PostgreSQL table | Source CSV | Grain | Key / modelling rule |
|---|---|---|---|
orders |
olist_orders_dataset.csv |
One order | order_id primary key |
order_items |
olist_order_items_dataset.csv |
One item line | Composite primary key (order_id, order_item_id) |
sellers |
olist_sellers_dataset.csv |
One seller | seller_id primary key |
order_reviews |
olist_order_reviews_dataset.csv |
One raw review row | No unique raw review ID; one row per order selected in SQL using ROW_NUMBER() |
Other files in the Olist release (such as customers, products, payments and geolocation) were not imported and are outside this project's scope.
Key choices:
- Join fan-out: item-line joins are not order-grain datasets. Seller KPIs use a
(seller_id, order_id)intermediate aggregation;COUNT(DISTINCT)is used when appropriate. - Delivery eligibility: overall late-rate denominator includes only
deliveredorders with both actual and estimated delivery dates. Delay is measured in calendar dates, not by comparing midnight estimate timestamps with arrival times. - Seller association: seller-related lateness uses only single-seller eligible orders and displays sellers with at least 30 eligible deliveries. It does not assign causal responsibility to sellers.
- Review deduplication: where orders have multiple review rows, select the most recently answered review, breaking ties by creation timestamp and then review ID. This is a documented analytical policy, not a claim that other reviews were erroneous; exact ties and alternative selection policies have not been fully audited.
- Review association: use one selected review per order before joining to delivery data; report review coverage separately. Results are descriptive, not causal.
Logical data model and metric definitions
SQL techniques and validation
- Relational joins, anti-joins, composite keys, conditional aggregation and CTEs.
- Window functions:
LAG()(month-over-month changes), rolling-windowSUM()(weighted trailing three-month late rates) andROW_NUMBER()(one review per order). - Source reconciliation: 112,650 item lines and R$13,591,643.70 in product item price sums preserved between raw item data and seller-order aggregations.
- Seller query equivalence: 3,095 sellers compared, 0 KPI mismatches in order count, item-line count and product item price sum.
- Final integrity checks: 0 orphan item-order links, orphan item-seller links, orphan review-order links, tested invalid item price/freight values and invalid review scores. This does not rule out every data-quality issue; eight
deliveredorders lack actual delivery timestamps and sixcanceledorders have them.
Query-performance experiment (local PostgreSQL only)
| Tested approach | Timed executions (ms) | Median execution (ms) |
|---|---|---|
| Two-stage seller-order CTE and seller aggregation (retained) | 313.7, 266.2, 322.7 | 313.7 |
Single-stage seller aggregation with COUNT(DISTINCT order_id) |
1,445.9, 840.5, 837.5 | 840.5 |
The retained approach had 62.7% lower median execution time relative to the alternative in this local three-run-per-query experiment. The alternative plan showed an external-merge sort and temporary I/O. This is a small, environment-specific comparison: not a measured production improvement, and not a claim that CTEs are universally faster.
Reproduce the analysis locally
- Install PostgreSQL (tested with 17.11) and pgAdmin 4; create a database named
olist_analytics. - Download the original CSVs from the Olist Kaggle dataset. No CSV files are redistributed here. See data/README.md for required filenames, source credit, licence and import settings.
- Run
sql/01_create_tables.sqlwhile connected toolist_analytics. It defines the four imported tables; do not assumeCREATE TABLE IF NOT EXISTSverifies an existing schema. - Use pgAdmin Import/Export Data to import the four CSVs into matching tables (CSV, UTF8, header enabled, comma delimiter). Import once into empty tables.
- Run the project SQL modules in sequence after loading the data. Validation and reconciliation scripts can be rerun without changing the source data.
SQL scripts:
| Module | File(s) |
|---|---|
| Connection, schema, and source validation | 00_environment_check.sql, 01_create_tables.sql, 02_data_validation.sql |
| Order join grain | 03_order_item_analysis.sql |
| Seller performance and reconciliation | 04_seller_geography.sql, 05_seller_scorecard.sql, 06_seller_delivery_kpi.sql, 07_reconciliation.sql |
| Delivery data quality, monthly and rolling KPIs | 08_delivery_data_quality.sql, 09_overall_delivery_kpis.sql, 10_monthly_delivery_trend.sql, 11_rolling_delivery_trend.sql |
| Review selection, association and coverage | 12_review_deduplication.sql, 13_delivery_review_association.sql, 14_review_coverage.sql |
| Execution plans, equivalence and integrity | 15_query_plan_comparison.sql, 16_seller_kpi_equivalence.sql, 17_final_integrity.sql |
#Optional diagnostics: review tie audit and benchmark environment record. These additions have no recorded execution outputs and do not change the historical findings.
Remaining analytical limitations
- Correlation between late deliveries and low review scores is not causation. Review coverage differs by late/on-time group, and selection effects remain possible.
- Seller-associated lateness does not establish seller responsibility; carrier and platform processes could contribute.
- The latest answered review per order is a documented selection policy, not a universal truth.
review_idcan repeat in the raw source. - Seller product-value totals use item prices, not audited revenue, cash collection or profit.
- Historical sample and local benchmark results do not represent current operations or production performance.
Repository structure
olist-sql-analytics/
├── README.md
├── data/
│   └── README.md              # instructions only; no source CSVs
├── docs/
│   ├── data_model.md
│   └── business_findings.md
├── sql/
│   ├── 00_environment_check.sql
│   ├── ...
│   └── 19_benchmark_environment.sql
└── .gitignore
Source, licensing and attribution
Source: Olist, Brazilian E-Commerce Public Dataset, Kaggle, CC BY-NC-SA 4.0. See source and import notes for attribution, licence links and handling of raw files. Olist does not endorse this independent analysis.
Data source, licence and local import
Original dataset and credit
- Dataset: Brazilian E-Commerce Public Dataset by Olist
- Publisher / data provider: Olist, via Kaggle
- Period: Historical, anonymised Brazilian marketplace transaction data, predominantly 2016–2018
- Source licence: Creative Commons Attribution–NonCommercial–ShareAlike 4.0 International (CC BY-NC-SA 4.0)
- Official source: https://www.kaggle.com/datasets/olistbr/brazilian-ecommerce
Attribution: Olist, Brazilian E-Commerce Public Dataset by Olist, Kaggle, licensed CC BY-NC-SA 4.0. This independent case study creates relational tables and aggregate statistics from the source dataset; it is not affiliated with, sponsored by or endorsed by Olist.
Licence conditions: Attribute the provider and link to the source and licence; the dataset is restricted to non-commercial uses, and adaptations shared publicly are subject to the ShareAlike requirement. This is a summary, not legal advice. If you plan to use the dataset or its adaptations for a commercial product, check whether you need separate permission. The licence for source data should not be confused with permissions for original SQL code.
Source-file policy
The original CSV files are intentionally not committed to this repository. Obtain them directly from Olist's Kaggle dataset page, check the licence, and retain the raw downloads locally. No original review comments, customer records, database backups or full source-data exports are provided in the public repository.
This project imported four source files only:
| Original CSV filename | Local PostgreSQL table | Verified imported rows | Purpose |
|---|---|---|---|
olist_orders_dataset.csv |
orders |
99,441 | Order status and purchase/delivery timestamps |
olist_order_items_dataset.csv |
order_items |
112,650 | Item-level seller, price and freight fields |
olist_sellers_dataset.csv |
sellers |
3,095 | Seller identity and location |
olist_order_reviews_dataset.csv |
order_reviews |
99,224 | Raw review score, text and timestamps |
Not used / not imported: customers, products, payments, geolocation, and product-category translations. These are available in the wider Olist dataset but fall outside the scope of this project.
The counts above are the rows actually verified in the project's PostgreSQL import; source providers may change releases or update content.
Local setup and import with pgAdmin 4
- Install PostgreSQL (the project was run on 17.11) and pgAdmin 4.
- Create a local PostgreSQL database named
olist_analytics. - Download and unzip the Olist dataset to a folder outside the public Git repository, for example
D:\olist_data\on Windows. - Run
sql/01_create_tables.sqlfrom the repository root while connected toolist_analyticsto createorders,order_items,sellers, andorder_reviews. - For each destination table, right-click the table in pgAdmin and select Import/Export Data...; use Import, CSV, UTF8, Header = Yes, Delimiter = comma. Select the corresponding source CSV. Keep the same column order as the file header.
- Import the four files into empty tables. Do not repeatedly import the same file into a populated table; primary key conflicts or duplicate reviews may result.
- Run
sql/02_data_validation.sqland the analysis/reconciliation scripts undersql/to verify the import before interpreting any KPI.
Import troubleshooting and modelling notes
- During the original local setup, a Windows path containing non-ASCII folder characters produced a
No such file or directoryerror in pgAdmin's import process. Moving the CSVs toD:\olist_data\resolved that instance; this does not prove all non-ASCII paths are unsupported. order_id,seller_id, andreview_idare identifiers, not arithmetic quantities. Seller postal-code prefixes were stored asTEXTto preserve identifier formatting.orders.order_idhas a primary key;order_itemsuses the composite primary key(order_id, order_item_id);sellers.seller_idhas a primary key.- The raw
order_reviewstable intentionally has no single-field primary key: the actual import has 99,224 rows, 98,410 distinctreview_idvalues, and 98,673 distinctorder_idvalues. Use the documentedROW_NUMBER()policy to select one review per order for order-grain analysis. The original rows are not deleted. - Foreign-key relationships were checked with anti-join/
NOT EXISTSqueries, rather than declared as physicalFOREIGN KEYconstraints. All three tested orphan-link counts were zero in the imported sample; constraints are not enforced automatically on future inserts. - Product item prices are recorded in Brazilian reais (BRL, R$).
SUM(price)is not a measure of verified net revenue, cash receipts, refunds, or profit. Freight is not included in this sum.
What the data-quality checks actually establish
| Check performed | Verified result |
|---|---|
order_items.order_id with no matching order |
0 rows |
order_items.seller_id with no matching seller |
0 rows |
order_reviews.order_id with no matching order |
0 rows |
Item rows with missing or negative price, or negative freight_value |
0 rows |
Review rows with missing or out-of-range (1–5) score |
0 rows |
Limits: The price/freight check did not explicitly test freight_value IS NULL. Passing the five tests does not establish that all attributes or business events are error-free. In particular, eight orders with order_status = 'delivered' had no actual delivery timestamp, while six canceled orders had one; these exceptions are documented and handled explicitly in analysis eligibility rules.
See data model, business findings, and the repository README for transformations, denominators and remaining limitations.
Data model and metric definitions
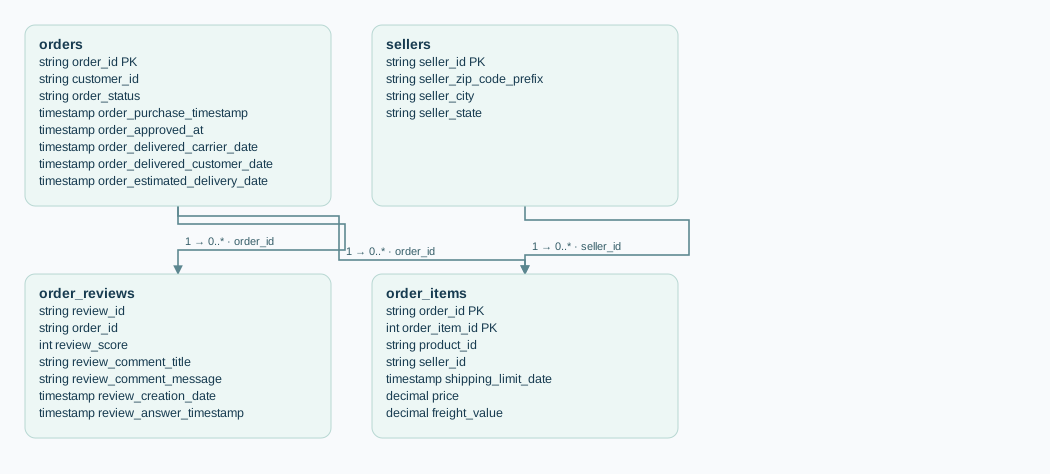
This document describes the completed local PostgreSQL portfolio analysis, not an enterprise production schema. Exactly four Olist source tables were imported and used: orders, order_items, sellers, and order_reviews. Other Olist datasets were not loaded.
Logical relationships (not enforced foreign keys)
View diagram source
erDiagram
    orders ||--o{ order_items : "order_id"
    sellers ||--o{ order_items : "seller_id"
    orders ||--o{ order_reviews : "order_id"

    orders {
        string order_id PK
        string customer_id
        string order_status
        timestamp order_purchase_timestamp
        timestamp order_approved_at
        timestamp order_delivered_carrier_date
        timestamp order_delivered_customer_date
        timestamp order_estimated_delivery_date
    }
    order_items {
        string order_id PK
        int order_item_id PK
        string product_id
        string seller_id
        timestamp shipping_limit_date
        decimal price
        decimal freight_value
    }
    sellers {
        string seller_id PK
        string seller_zip_code_prefix
        string seller_city
        string seller_state
    }
    order_reviews {
        string review_id
        string order_id
        int review_score
        string review_comment_title
        string review_comment_message
        timestamp review_creation_date
        timestamp review_answer_timestamp
    }
Important: These are logical relationships. The project created primary keys for the first three tables but did not add physical FOREIGN KEY constraints. Orphan-row validation subsequently found zero unmatched references in the tested relationships, which does not enforce future integrity. The two PK labels in order_items refer to the composite (order_id, order_item_id) key, not two independent primary keys.
Imported tables and grains
| Relation | Verified rows | One row represents | Physical key / qualification |
|---|---|---|---|
orders |
99,441 | One marketplace order | order_id PK |
order_items |
112,650 | One item line within an order | (order_id, order_item_id) composite PK |
sellers |
3,095 | One seller | seller_id PK |
order_reviews |
99,224 | One raw review record | No PK asserted for raw reviews; repeated review IDs and order IDs observed |
order_item_id numbers the item within an order and is not a globally unique key. An order may have multiple items and may involve more than one seller; seller/order is effectively a many-to-many relationship through item lines. The raw Review table has 98,410 distinct review_id values and 98,673 distinct order_id values, so neither field alone can be assumed unique there.
Out of scope: Olist customer, product, payment, geolocation and category-translation tables. No unique-customer or customer-location measures are claimed.
Intermediate analytical datasets and their grains
| CTE / derived result | Analytical grain | Rule / use |
|---|---|---|
sellers_per_order |
One order with items | COUNT(DISTINCT seller_id) identifies single- versus multi-seller orders |
seller_order_facts |
One (seller_id, order_id) pair |
Item-line count and product item price sum for a seller's contribution to an order |
| Seller scorecard | One seller | Orders handled, item lines, item price sum, mean product value per associated order |
| Seller delivery eligibility | One eligible single-seller delivered order | Both actual/estimated timestamps present; seller attribution less ambiguous but not causal |
| Overall delivery eligibility | One eligible delivered order | Status delivered and both dates present; not limited to single-seller orders |
monthly_kpis |
One purchase month | Late orders and eligible deliveries by purchase month |
ranked_reviews |
One original review row plus rank | ROW_NUMBER() within each order |
selected_reviews |
One reviewed order | Keep latest answered review according to the ranking policy |
| Reviewed deliveries | One eligible delivered order with selected review | Inner join from eligible orders to selected reviews |
| Review coverage groups | One delivery group | Left join to retain and count eligible deliveries without reviews |
KPI definitions
Seller metrics
orders_handled: distinct orders associated with the seller, not summable to unique marketplace orders across multiple sellers.total_items: item-line count; no separate physical-unit quantity field is assumed.total_product_value:SUM(order_items.price), excluding freight; not net revenue, cash received or profit. The seller scorecard did not apply an order-status filter.avg_product_value_per_order: total product item value contributed by the seller divided by orders handled.seller-associated late_delivery_pct: late orders / eligible single-seller delivered orders for that seller. The reported top-ten screen shows sellers with at least 30 eligible orders; not a causal seller-fault metric.
Overall delivery metrics
- Eligible order:
order_status = 'delivered'and non-NULL actual and estimated delivery timestamps. delay_days = actual_delivery::DATE - estimated_delivery::DATE: calendar-day difference; late if strictly greater than zero and on-time/early otherwise.- Late rate = late eligible delivered orders / all eligible delivered orders. This denominator includes both single- and multi-seller orders.
avg_late_daysaverages only positivedelay_daysamong late orders; early deliveries must not offset late days.- Purchase-month late rate groups by
DATE_TRUNC('month', order_purchase_timestamp); it measures how each purchase cohort ultimately performed, rather than deliveries physically occurring in that month. LAG()uses the previous observed month row; missing months can cause a nonconsecutive comparison. The trailing three-month rate is a weighted ratio: rollingSUM(late_orders)/ rollingSUM(eligible_orders), on continuous 2017-01 to 2018-08 rows with incomplete windows removed.
Review-based measures
- Raw Review rows are preserved. For order-level rating analysis, use
ROW_NUMBER() OVER (PARTITION BY order_id ORDER BY review_answer_timestamp DESC NULLS LAST, review_creation_date DESC NULLS LAST, review_id DESC NULLS LAST)and retainrn = 1. - This latest-answered selection is an analytical convention, not proof the selected review is more accurate. Fully tied sorting keys could be non-deterministic, and tie-auditing and alternative review-selection sensitivity testing were not completed.
- Review score is 1–5. Low score means 1–2 stars. Delay groups: on-time/early (≤0 days), 1–3, 4–7, 8–14 and 15+ days late.
- Customer review analysis includes only eligible deliveries with selected reviews. The coverage rate retains all eligible deliveries in the denominator, using
LEFT JOINto count missing reviews. - Grouped scores and low-rating rates are associations, not causal impact estimates. Carrier, product, seller, sample and other factors were not controlled for.
Review timing relative to actual delivery has not been audited; these comparisons should not be interpreted as exclusively post-delivery assessments.
Validation and limitations
- Join-grain check: 112,650 joined item-level rows correspond to 98,666 different orders with item records; 775 additional orders have no item match.
- Source reconciliation: 112,650 item lines and R$13,591,643.70 product item price sum remain unchanged after seller-order intermediate aggregation.
- Seller equivalence test: 3,095 seller records compared between two aggregate query strategies; zero differences in orders handled, item lines or item price sums.
- Data linking: zero orphan
order_items→orders,order_items→sellersandorder_reviews→orderslinks in the imported sample, but no enforced database FK constraints. - Value checks: no NULL or negative
price, negativefreight_value, or NULL/out-of-rangereview_scoreidentified by the five tested counts. NULL freight was not directly tested. - Order lifecycle anomalies: eight
deliveredorders have no actual delivery date; sixcanceledorders do have an actual delivery date. The overall late-delivery denominator excludes records missing required dates or not markeddelivered. - Time-window limitation: the dataset is historical and bounded; purchases near extract boundaries and non-observed orders can affect interpretation of purchase-month comparisons.
See detailed business findings, data source and licence and the project overview.
Business findings and validation evidence
Project: E-Commerce Order Fulfilment & Seller Performance Analysis Status: Completed independent SQL case study; historical Olist public dataset, not commissioned operational work. Basis: Query results and screenshots produced during the project's local PostgreSQL exercises. Figures are descriptive; no business intervention, realised savings, ROI or deployed production optimisation is claimed.
1. Source coverage and join grain
| Imported relation | Verified rows |
|---|---|
orders |
99,441 |
order_items |
112,650 |
sellers |
3,095 |
order_reviews |
99,224 |
orders INNER JOIN order_items returned 112,650 item-level rows representing 98,666 distinct orders. The 775 orders without any matching item lines break down as follows:
| Order status | Orders without item lines |
|---|---|
unavailable |
603 |
canceled |
164 |
created |
5 |
invoiced |
2 |
shipped |
1 |
| Total | 775 |
Interpretation: COUNT(*) after a one-to-many join counts joined rows, not necessarily marketplace orders. COUNT(DISTINCT) can remove matched-order duplication but cannot recover unmatched orders excluded by INNER JOIN. Missing item matches are not by themselves evidence of an operational error.
2. Seller portfolio and attribution
A three-table join (sellers, order_items, orders) produced these selected seller-state results:
| Seller state | Distinct sellers | Distinct associated orders | Item lines | Product item price sum |
|---|---|---|---|---|
| SP | 1,849 | 70,188 | 80,342 | R$8,753,396.21 |
| PR | 349 | 7,673 | 8,671 | R$1,261,887.21 |
| MG | 244 | 7,930 | 8,827 | R$1,011,564.74 |
Seller locations are not customer locations. If an order involves sellers in more than one state, distinct-order counts can appear under more than one state; do not sum those state counts to get marketplace-wide unique orders. Item price sums are not cash revenue or profit and were not filtered by final order status in the seller sales-value scorecard.
Order/seller structure
| Group | Orders with item records |
|---|---|
| Single seller | 97,388 (98.70%) |
| Multiple sellers | 1,278 (1.30%) |
| Total | 98,666 |
A seller-order CTE (one record per seller–order pair) avoids mistaking multiple item lines for multiple orders handled. Two leading sellers by product item price value illustrate why one KPI is insufficient:
| Seller rank | State | Orders handled | Item lines | Product item price sum | Mean item value per associated order |
|---|---|---|---|---|---|
| 1 | SP | 1,132 | 1,156 | R$229,472.63 | R$202.71 |
| 2 | BA | 358 | 410 | R$222,776.05 | R$622.28 |
The second seller's mean item value per associated order is approximately 3.07× the first seller's, but this does not show higher profitability or labour productivity.
Seller-associated delivery screening
Seller-specific delay screening uses only single-seller orders that were delivered and have both actual and estimated timestamps. A delivery is late when actual_delivery::DATE > estimated_delivery::DATE. The displayed ranking requires at least 30 eligible delivered orders per seller.
| Rank shown | State | Eligible orders | Late orders | Late rate |
|---|---|---|---|---|
| 1 | SP | 33 | 12 | 36.36% |
| 2 | SP | 43 | 14 | 32.56% |
| 3 | PR | 72 | 22 | 30.56% |
| 10 | SP | 34 | 7 | 20.59% |
The displayed top-ten rates range from 20.59% to 36.36%. A 33-order denominator near the 30-order threshold limits ranking stability. These are seller-associated results; they cannot establish responsibility for delay by the seller versus carrier or platform.
3. Data quality and delivery eligibility
In orders, 2,965 records lacked order_delivered_customer_date. The status breakdown was:
| Status | Total orders | Missing actual customer-delivery timestamp |
|---|---|---|
| shipped | 1,107 | 1,107 |
| canceled | 625 | 619 |
| unavailable | 609 | 609 |
| invoiced | 314 | 314 |
| processing | 301 | 301 |
| delivered | 96,478 | 8 |
| created | 5 | 5 |
| approved | 2 | 2 |
| All statuses | 99,441 | 2,965 |
Most missing timestamps are consistent with non-delivered lifecycle statuses. However, 8 delivered orders lacked an actual delivery timestamp, while 6 canceled orders had one. The six observed canceled examples were purchased in 2016; the underlying cancellation reasons are unknown. These exceptions were recorded, not silently corrected.
Overall delivery KPI eligibility: require order_status = 'delivered', a non-NULL actual delivery timestamp and a non-NULL estimated delivery timestamp. Use calendar dates, not full timestamps. This population is not restricted to single-seller orders.
| Delivery KPI | Verified result |
|---|---|
delivered status orders |
96,478 |
delivered orders without actual delivery timestamp |
8 |
| Eligible delivered orders | 96,470 |
| Late delivered orders | 6,534 |
| On-time or early delivered orders | 89,936 |
| Late-delivery rate | 6.77% |
| Mean days late among late orders only | 10.62 calendar days |
Arithmetic cross-checks: 96,478 − 8 = 96,470; 6,534 + 89,936 = 96,470. Average positive delay days is distinct from average signed delivery-date offset (where early arrivals would offset late arrivals).
4. Monthly trends and a weighted rolling rate
These metrics group by purchase month, describing the eventual fulfilment of orders purchased in that month—not deliveries that occurred during that month.
| Purchase month | Eligible orders | Late orders | Monthly late rate | Change from prior observed month |
|---|---|---|---|---|
| 2017-10 | 4,478 | 187 | 4.18% | −0.21 pp |
| 2017-11 | 7,288 | 904 | 12.40% | +8.22 pp |
| 2017-12 | 5,513 | 411 | 7.46% | −4.94 pp |
| 2018-02 | 6,555 | 926 | 14.13% | +8.43 pp |
| 2018-03 | 7,003 | 1,328 | 18.96% | +4.83 pp |
| 2018-04 | 6,798 | 306 | 4.50% | −14.46 pp |
The high observed late rates in November 2017 and February–March 2018 merit further investigation, but no cause or corrective action was measured. Sparse early sample months (e.g., September 2016: one eligible order, one late order) can produce unstable percentages. LAG() references the previous available row, not necessarily the previous calendar month if a month is missing.
Trailing three-month late rate: rolling SUM(late_orders) / SUM(eligible_orders) over three continuous observed purchase months, not the simple average of three percentages. The calculation covered 2017-01 through 2018-08 and excluded the two initial incomplete windows.
| Month | Monthly late % | Weighted rolling 3-month late % |
|---|---|---|
| 2018-01 | 5.70 | 8.65 |
| 2018-02 | 14.13 | 9.09 |
| 2018-03 | 18.96 | 12.88 |
| 2018-04 | 4.50 | 12.58 |
| 2018-05 | 6.56 | 10.11 |
| 2018-06 | 1.16 | 4.17 |
| 2018-07 | 3.38 | 3.80 |
| 2018-08 | 6.19 | 3.61 |
The April rolling rate stayed elevated because its window still included February and March. The reduction by June describes observed data, not a demonstrated process intervention. Historical extract boundaries and completion eligibility can affect purchase-month trends.
5. Review profiles, deduplication and customer experience
| Raw review measure | Verified count |
|---|---|
| Review rows | 99,224 |
| Distinct review IDs | 98,410 |
| Distinct reviewed order IDs | 98,673 |
| Orders with multiple review rows | 547 |
| Maximum review rows per order | 3 |
| Orders with conflicting review scores | 202 |
| Additional review rows beyond one per order | 551 |
The duplicate counts imply 543 orders with two review rows and 4 with three. The raw score distribution was: 1 star 11,424; 2 stars 3,151; 3 stars 8,179; 4 stars 19,142; 5 stars 57,328 (sum = 99,224).
To avoid giving multiply reviewed orders extra statistical weight, ROW_NUMBER() retains the review with the latest answer timestamp for each order (secondary ordering by creation timestamp and review ID). Selected reviews: 98,673 rows = 98,673 unique orders, with mean selected rating 4.09/5. The selection rule is a documented convention; exact-tie audit and sensitivity to alternative choices were not conducted.
Ratings by actual delivery delay
Only eligible delivered orders with a selected review are included in these rating groups.
| Delay category | Reviewed eligible orders | Average score | 1–2 star orders | 1–2 star share |
|---|---|---|---|---|
| On-time / early | 89,443 | 4.29 | 8,289 | 9.27% |
| Late 1–3 days | 1,852 | 3.29 | 595 | 32.13% |
| Late 4–7 days | 1,748 | 2.10 | 1,183 | 67.68% |
| Late 8–14 days | 1,446 | 1.67 | 1,159 | 80.15% |
| Late 15+ days | 1,335 | 1.72 | 1,046 | 78.35% |
| Total reviewed eligible deliveries | 95,824 | — | — | — |
Finding: Greater delivery delays are generally associated with lower reviews and a higher share of 1–2-star ratings. The pattern is not strictly monotonic: the 15+ day group's low-score rate (78.35%) is below the 8–14 day group's (80.15%). These observational results do not prove that delay caused dissatisfaction; other unmeasured factors may contribute.
Review coverage
| Delivery group | Eligible orders | Reviewed | Unreviewed | Coverage |
|---|---|---|---|---|
| Late | 6,534 | 6,381 | 153 | 97.66% |
| On-time / early | 89,936 | 89,443 | 493 | 99.45% |
| Total | 96,470 | 95,824 | 646 | 99.33% |
Coverage differs by 1.79 percentage points. The 646 unreviewed eligible orders were excluded from rating comparisons; their satisfaction is unknown. High coverage does not eliminate potential selection bias.
Possible operational follow-up (not tested): investigate the experience of orders delayed four days or more, accounting for carrier, seller, product and response-selection factors before designing interventions.
6. KPI reconciliation and final source integrity
- Item-line transformation: 112,650 source rows vs 112,650 aggregated item counts; R$13,591,643.70 source product item value vs R$13,591,643.70 aggregated value.
- Alternative seller-query equivalence: 3,095 sellers compared for
orders_handled, item-line count and product item price sum; 0 mismatches using aFULL OUTER JOINandIS DISTINCT FROM. - Final source integrity checks returned zero for each of five categories:
order_itemsunmatched to orders;order_itemsunmatched to sellers;order_reviewsunmatched to orders; missing/negative product prices or negative freight; and missing/out-of-range (not 1–5) review scores.
Limit of tests: this does not assert that every field is complete, that all lifecycle states are consistent, or that actual foreign keys are enforced. freight_value IS NULL was not separately tested, and the eight-delivered/six-canceled date anomalies remain documented exceptions.
7. SQL execution-plan and repeat benchmark
Question: Can direct seller grouping with COUNT(DISTINCT order_id) replace the intermediate seller-order CTE without changing results, and is it faster?
The KPI equivalence test passed for all 3,095 sellers, with 0 differences in three metrics. Original plan: Index Scan, Incremental Sort, GroupAggregate, Hash Join, HashAggregate and top-N heapsort. Alternative plan: Seq Scan, Hash Join, Sort, GroupAggregate; the initial alternative execution had external merge, disk 9,432 kB, with temp block reads/writes. The alternative's temporary I/O is a plausible performance contributor, not a complete causal explanation.
Local PostgreSQL 17 repeat benchmark (one warm-up each; timed order A1, B1, B2, A2, A3, B3):
| Run | Original: two-stage (ms) | Alternative: direct DISTINCT (ms) |
|---|---|---|
| 1 | 313.7 | 1,445.9 |
| 2 | 266.2 | 840.5 |
| 3 | 322.7 | 837.5 |
| Median | 313.7 | 840.5 |
The original approach had 62.7% lower median measured execution time than the alternative in this small local test (alternative around 2.68× the original median). Decision: retain the original approach. These are not production measurements, deployed speedups or evidence of a universal performance rule; only three timed runs were recorded per query.
8. Scope and evidence boundaries
- Source / licence: Olist, Brazilian E-Commerce Public Dataset by Olist, Kaggle, CC BY-NC-SA 4.0. Four source tables imported; no customer/product/payment/geolocation data joined in this project.
- Historical observational data: no employer deployment, ROI, reported savings, actual reductions in delays or customer-satisfaction improvement were measured.
- Causality: a seller being associated with an order or a late shipment does not establish seller responsibility; delay-rating associations do not establish causation.
- Analysis boundaries: review selection is a modelling choice; review coverage differs by delivery outcome; bounded purchase-month data may have completion/selection effects; sample-size thresholds are analytical decisions, not industry standards.
- Not completed: alternative review-selection sensitivity, tie audit, further causal controls, production-scale benchmarks and a full data-quality audit of every field.
See SQL module index, data model and source/import guidance.