← All projects / 01
Technical case study · 01
Procurement & Fleet Analytics
A repeatable reporting pipeline combining procurement KPIs, contract analysis and separate fleet reporting for management use.
The decision and reporting model
I replaced fragmented spreadsheet-led reporting with a Power BI view of current-month purchasing activity, annual supplier / contract analysis and outstanding purchase commitments. I introduced Open Orders to show commitments not yet reflected in invoiced expenditure.
Model boundaries: a procurement table (ProcRep) is related to RollingCalendar; Value Tiers is intentionally disconnected. Fleet service and fleet reference tables are analysed separately.
Dashboard evidence
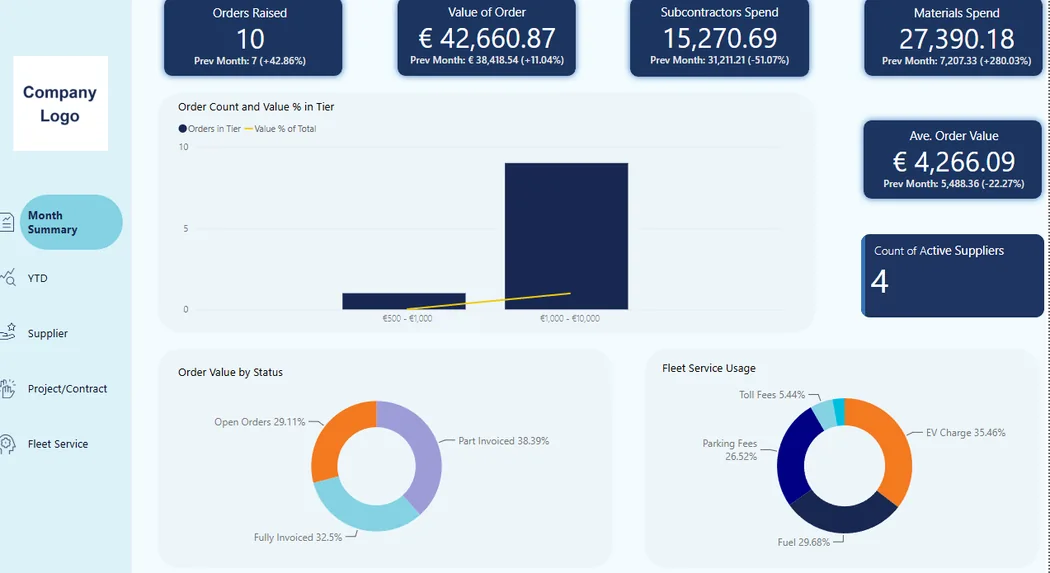
Anonymised demonstration · latest-month KPIs
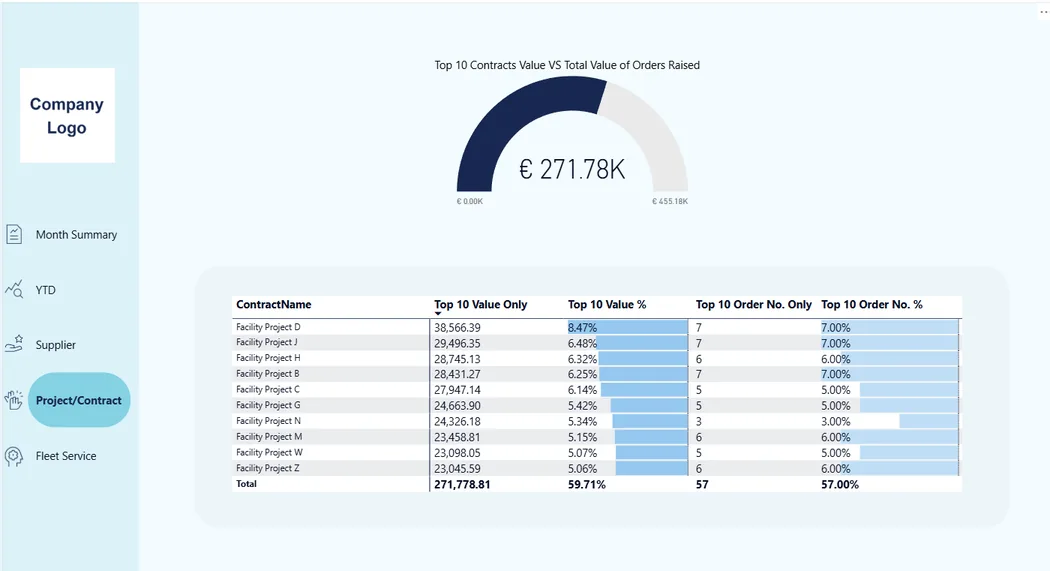
Anonymised demonstration · annual Top 10 contract analysis
DAX: month anchors and value-based ranking
Monthly KPIs use the latest order date to derive the report month. Contract ranking uses total order value as the ranking criterion, while order counts are calculated for those selected contracts.
Latest-month value
Current Month Order Value =
VAR StartDate = [Report Month Start]
VAR EndDate   = [Report Month End]
RETURN
    CALCULATE(
        [Total Value of Orders Raised],
        REMOVEFILTERS('RollingCalendar'),
        DATESBETWEEN('RollingCalendar'[Date], StartDate, EndDate)
    )
Top 10 contracts by value
Top 10 Contracts Value =
CALCULATE(
    [Total Value of Orders Raised],
    KEEPFILTERS(
        TOPN(10, ALL('ProcRep'[ContractName]),
             [Total Value of Orders Raised], DESC)
    )
)
These are curated excerpts of the validated DAX examples. Ties at rank 10 may produce more than ten contracts. Time intelligence depends on the date-table relationship and report filtering.
ETL: synthetic, runnable M demonstrations
The original Power Query steps are not available for publication. I reconstructed three representative transformations from the documented working method: manually curated supplier alias mapping, parsing GBP/EUR amounts in CSV cells, and normalising heterogeneous fleet records before appending them.
| Demonstration | Verified scope |
|---|---|
| Supplier mapping | 9 synthetic orders retained; matched, unmatched and missing suppliers labelled |
| Currency handling | £ and € parsing, illustrative rate, missing and invalid value flags |
| Fleet consolidation | 5 records across Fuel / Toll / Parking / EV; consistent columns and EUR total |
The 1.20 GBP-to-EUR rate is a demonstration assumption, not an asserted historical accounting policy.